

The RQ50
The RQ50 is a ranking of the 50 most research-productive public companies in the United States. It is based on the Research Quotient (RQ) — a measure of a company's ability to generate revenue growth from R&D investment — developed by Anne Marie Knott.
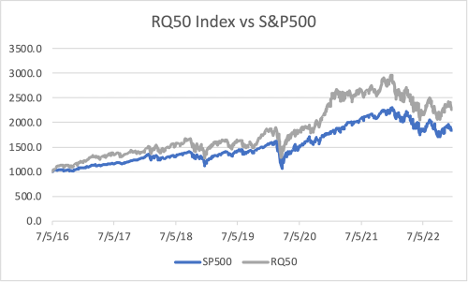
Unlike traditional R&D rankings that simply measure spending, RQ measures the return on that spending. Companies with high RQs generate significantly more revenue per dollar of R&D than their peers — and historically, RQ50 companies have substantially outperformed the S&P 500.
RQ50 vs. S&P 500
Current RQ50 Companies

About the Research Quotient
RQ is estimated from a firm's production function — the relationship between its inputs (capital, labor, R&D) and its output (revenue). A higher RQ means a company converts R&D spending into revenue more efficiently than competitors.
The methodology is described in detail in How Innovation Really Works (McGraw-Hill, 2017) and in peer-reviewed publications in Management Science and Strategic Management Journal.
Learn more about Practice